Bower เป็นแหล่งรวบรวม Package เช่น JavaScript, CSS Package ตัวอย่าง Bootstrap, Highcharts เป็นต้น ในที่นี้เราจะติดตั้ง Highcharts และทดลองใช้งานใน Yii Framework 2
การติดตั้ง
ก่อนอื่น เรามาเตรียมตัวก่อนการใช้งานโดยต้องติดตั้ง Node.js และ ทำการ install bower ให้เรียบร้อยโดยใช้คำสั่ง
npm install -g bower
จากนั้นเข้าไปที่ Project ของ Yii Framework 2 แล้วทดลองติดตั้ง Higcharts โดยพิมพ์คำสั่ง
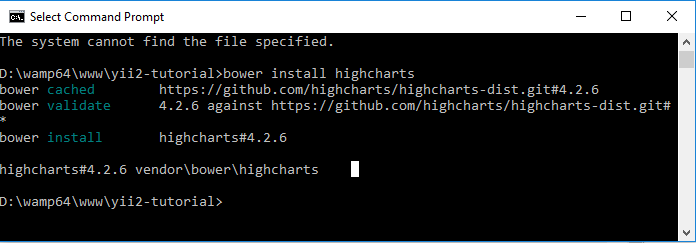
bower install highcharts
เมื่อติดตั้งเสร็จจะได้ดังนี้

เมื่อเปิดดูใน vendor จะมี bower/highcharts เกิดขึ้น (vendor/bower/highcharts)
การสร้าง Asset ใน Yii2
ใน Yii Framework 2 ให้สร้าง Asset เพื่อ Register Asset ใน bower โดยสร้างไฟล์ที่ frontend/assets/HighchartsAsset.php แล้วเขียนโปรแกรมดังนี้
<?php
namespace frontend\assets;

use yii\web\AssetBundle;

class HighchartsAsset extends AssetBundle
{
	public $sourcePath = '@bower/highcharts';
	public $css = [];
	public $js = [
		'highcharts.js',
		'highcharts-more.js',
	];

	public $depends = [
		'yii\web\JqueryAsset'
	];
}
สร้าง Controller เพื่อทดสอบ
สร้าง Controller เพื่อทดสอบเรียกใช้งานโดยสร้าง frontend/controllers/HighchartsController.php
<?php
namespace frontend\controllers;

use yii\web\Controller;

class HighchartsController extends Controller
{
	public function actionIndex()
	{
		return $this->render('index');
	}
}
สร้าง View
ทำการสร้าง View เพื่อลงทะเบียน Asset และ เรียกใช้งาน Higcharts โดย View จะอยู่ที่ views/highcharts/index.php
<?php
use frontend\assets\HighchartsAsset;

HighchartsAsset::register($this);
$this->title = 'Highcharts Test';
?>

<div id="my-chart" style="min-width: 310px; height: 400px; margin: 0 auto"></div>


<?php $this->registerJs("
$(function () {
    $('#my-chart').highcharts({
        title: {
            text: 'Monthly Average Temperature',
            x: -20 //center
        },
        subtitle: {
            text: 'Source: WorldClimate.com',
            x: -20
        },
        xAxis: {
            categories: ['Jan', 'Feb', 'Mar', 'Apr', 'May', 'Jun',
                'Jul', 'Aug', 'Sep', 'Oct', 'Nov', 'Dec']
        },
        yAxis: {
            title: {
                text: 'Temperature (°C)'
            },
            plotLines: [{
                value: 0,
                width: 1,
                color: '#808080'
            }]
        },
        tooltip: {
            valueSuffix: '°C'
        },
        legend: {
            layout: 'vertical',
            align: 'right',
            verticalAlign: 'middle',
            borderWidth: 0
        },
        series: [{
            name: 'Tokyo',
            data: [7.0, 6.9, 9.5, 14.5, 18.2, 21.5, 25.2, 26.5, 23.3, 18.3, 13.9, 9.6]
        }, {
            name: 'New York',
            data: [-0.2, 0.8, 5.7, 11.3, 17.0, 22.0, 24.8, 24.1, 20.1, 14.1, 8.6, 2.5]
        }, {
            name: 'Berlin',
            data: [-0.9, 0.6, 3.5, 8.4, 13.5, 17.0, 18.6, 17.9, 14.3, 9.0, 3.9, 1.0]
        }, {
            name: 'London',
            data: [3.9, 4.2, 5.7, 8.5, 11.9, 15.2, 17.0, 16.6, 14.2, 10.3, 6.6, 4.8]
        }]
    });
});
")?>
สามารถดูตัวอย่าง Chart จาก Demo ได้ที่
http://www.highcharts.com/demo
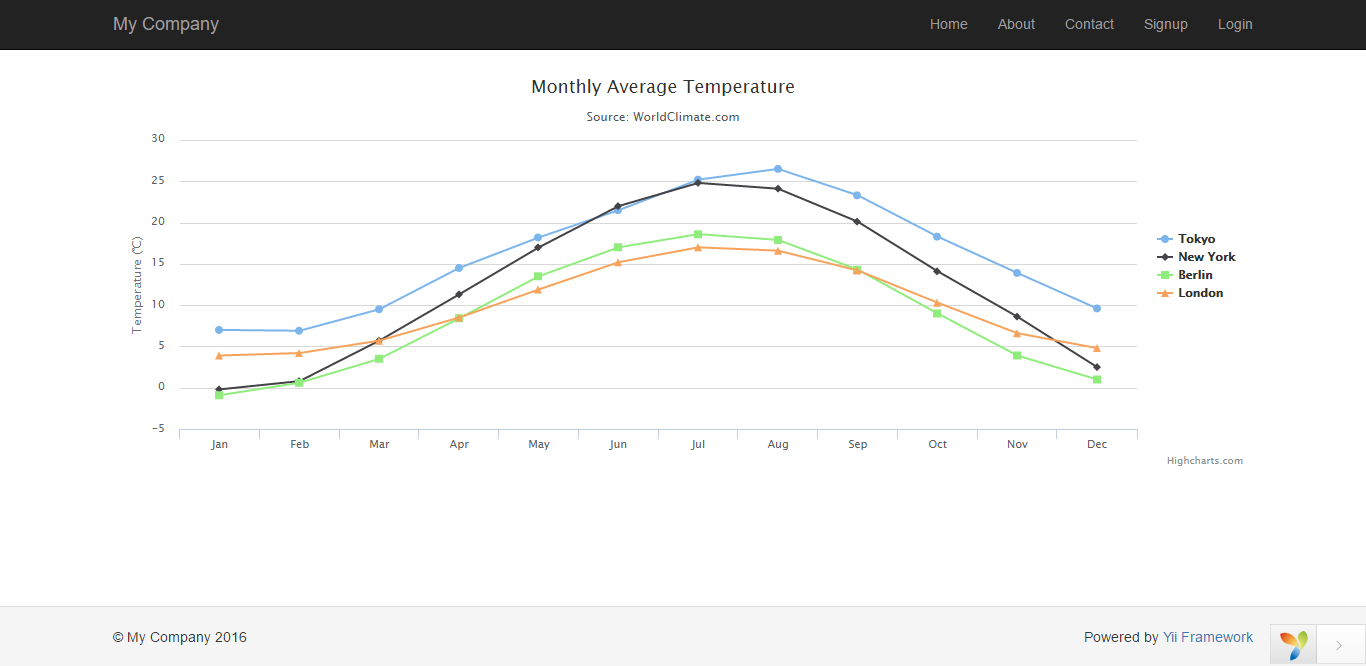
เมื่อเรียก Url เพื่อทดสอบการแสดงผลจะได้ดังนี้
http://localhost/yii2-tutorial/frontend/web/index.php?r=highcharts/index


ความคิดเห็น